

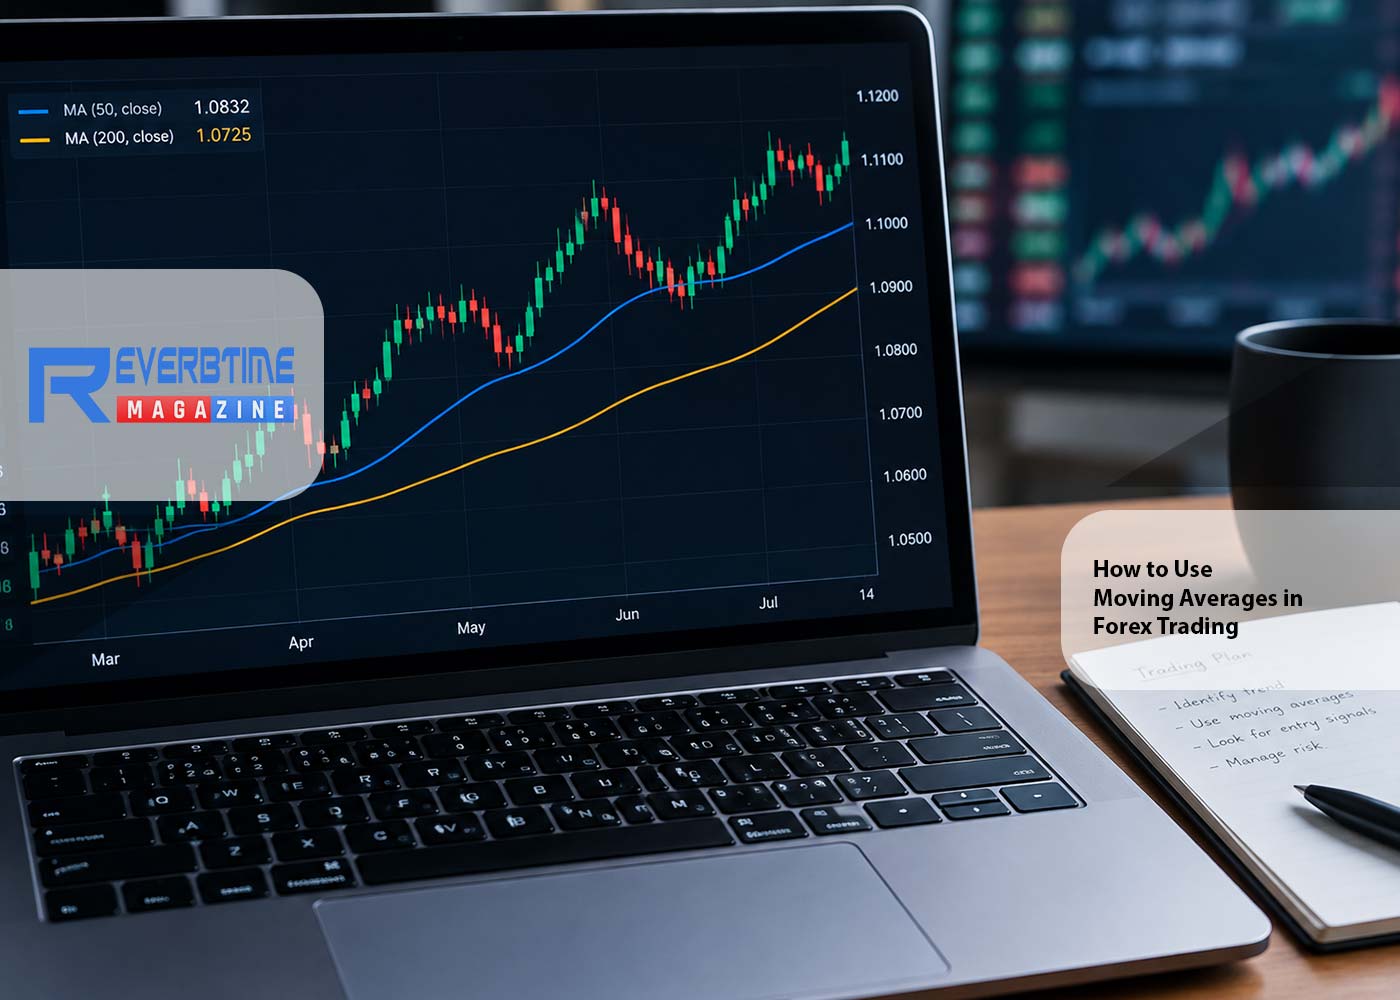
A moving average smooths out price into a single line,
making the underlying trend easier to see through the day to day noise. It is
one of the simplest tools on a chart and still one of the most used, for good
reason.
Simple versus exponential
A simple moving average treats every closing price the same
across a set number of periods. An exponential moving average gives recent
prices more weight, so it reacts faster to a fresh move. Neither version is
always better. The choice depends on what you want the line to do.
Traders who need fast signals, day traders and scalpers
among them, tend to favor the exponential version. Traders holding for days or
weeks often lean toward the simple version. It smooths out noise a fast trader
would rather see.
Using a moving average as dynamic support or resistance
During a clear trend, price often pulls back to a moving
average and bounces off it. The line acts almost like a moving version of
support or resistance. This works best in a trending market. It tends to break
down in a choppy, sideways one, where price crosses the line often with no real
meaning behind it.
A trader building toward a Free Funded Account can use this
bounce as an entry signal, as long as the wider trend backs it up. The same
setup in a flat market produces far weaker results than it does inside a real
trend.
Crossover signals
A crossover happens when a shorter moving average crosses a
longer one. A shorter average crossing above a longer one is often called a
golden cross and read as bullish. The reverse, a shorter average crossing
below, is called a death cross and read as bearish.
These signals do not tell you how far price will travel.
They can also arrive late, after a real move has already covered some ground.
What they offer is a simple, repeat way to confirm that momentum has truly
shifted, instead of reading that shift off a gut feeling alone.
A common pairing
A fifty period average paired with a two hundred period
average is a widely used combination. It adapts to whichever chart timeframe
you actually trade. Shorter pairings react faster and give more signals. Longer
pairings react slower and give fewer, cleaner ones.
Where moving averages fall short
- They lag price by nature, since every average is built
from data that already happened
- They produce frequent false signals in a market moving
sideways without a clear trend
- They say nothing about news, fundamentals, or anything
outside price itself
- Two traders using the same average can still read the same
bounce two different ways
Most traders pair a moving average with another tool, such
as support and resistance or a simple trend filter, rather than trading the
average completely alone.
A simple way to test one on your own charts
Add a single average to a chart you already trade and watch
it for a week before acting on it. Note every time price touches the line and
what happens next. This costs nothing and takes little time, and it beats
reading about the idea without ever checking whether it holds up on the pairs
you actually trade.
Building it into a routine
Pick one or two moving averages and learn how they behave on
the pairs you actually trade before adding more. A 1 step challenge prop firm
account rewards a setup you know well over a pile of tools nobody has fully
tested. One plain average, used the same way every time, usually beats a busy
chart no one can read fast under pressure.
Share:


